3QFY2019 Result Update | Auto Ancillary
February 13, 2019
Automotive Axles
BUY
CMP
`1109
Target Price
`1450
Investment Period
12 Months
Performance Update
Quarterly (` cr)
Q3FY19
Q3FY18
% yoy Q2FY19
% qoq
Stock Info
Net sales
486
408
19%
498
-3%
Sector
Auto Ancillary
EBITDA
56
44
26%
59
-5%
Market Cap (` cr)
1,676
Net Debt (` cr)
-
EBITDA margin (%)
11.5%
10.8%
63
11.8%
-97
Beta
0.9
Adjusted PAT
30.39
21.19
43.4%
32.00
-5%
52 Week High / Low
1820/991
Avg. weekly Volume
4,014
In Q3FY2019, on standalone basis, revenue of Automotive Axles Ltd. (AAL) was up 19%
Face Value (`)
10
yoy at
`486cr despite the slowdown in commercial vehicles during the quarter.
BSE Sensex
36,153
However, on qoq basis, revenue was lower by 3%. OPM improved by 63bps yoy to
Nifty
10,831
Reuters Code
ATOA.BO
11.45% on account of better utilization, EBIDTA was higher 26% yoy to `56cr as
Bloomberg Code
ATXL IN
compared to `44cr in Q3FY2018. Profit for Q3FY2019 increased to `30cr on the back
of stable depreciation cost, which aid PAT growth of 43% to `30cr yoy basis. All in all,
Shareholding Pattern (%)
Promoters
71.0
for the quarter under review, Automotive Axles has delivered good performance in a
MF / Banks / Indian Fls
8.9
tough environment where the sales and production of OEMs has remained flat.
FII / NRIs / OCBs
1.4
Indian Public / Others
18.7
For 9MFY2019, AAL has reported 34% yoy growth in top-line to
`1,458cr from
Abs.(%)
3m
1yr
3yr
`1,084cr in 9MFY2018. Operating profit also improved by 53% yoy to `171cr as
Sensex
(4.1)
6.3
26.7
against `112cr in 9MFY2018. OPM improved by 140bps to 11.7% yoy vs. 10.3%
Automotive Axles
(22.1)
(35.6)
52.5
during the same period last year on account of improving utilization on various cost
efficiency measures. Profit came in higher by 65% yoy `92cr as against `52cr in
9MFY2018.
We expect, AAL’s revenue to register 30% CAGR over FY2018-20E to `2,584cr and PAT
to grow at 31% CAGR during the same period to `147cr.
Going forward, we expect utilization to improve further on account of increasing
demand in M&HCV and LCV segments; further availability of finance will also improve
the sentiment in the industry.
Key things to watch for: (1) Growth in revenue from slip suspension, (2) Capacity
utilization and expansion plans, and (3) Increasing pie from export revenue.
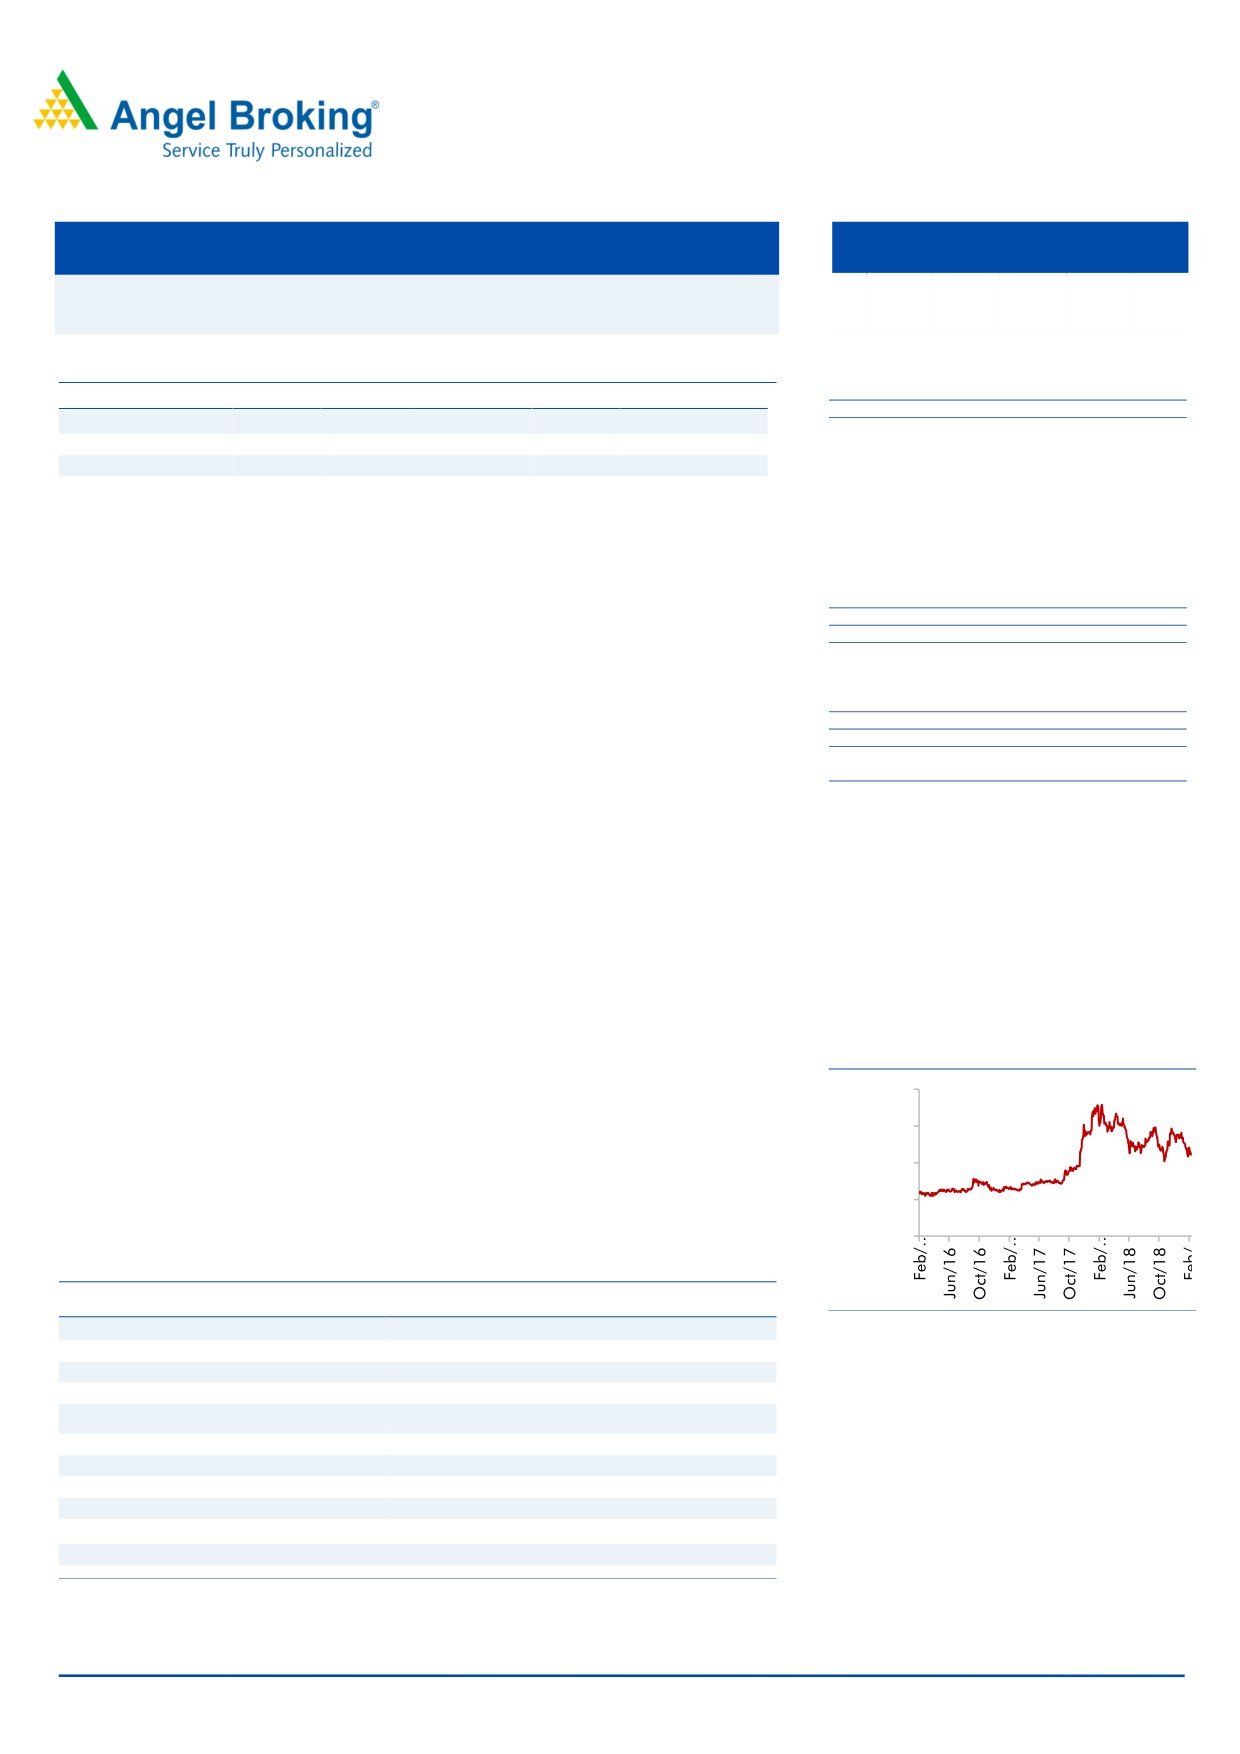
3years performance chart
2,000.00
Outlook & Valuation: We believe AAL is comfortably placed to tap the upcoming
1,500.00
opportunity in the industry owing to improving road infra, BS-VI pre-buying and foray
into new segments coupled with expansion of capacity by 35-40%. At the CMP of
1,000.00
`1,109, the stock is available at 12x its FY2020E EPS of ` 97. We have assigned a
multiple of 15x and recommend BUY on AAL with a Target Price of `1,450, implying an
500.00
upside of 30%.
0.00
Key Financials
Y/E March (` cr)
FY17
FY18
FY19E
FY20E
Net Sales
1,172
1,519
2,070
2,584
Source: Company, Angel Research
% chg
8
30
36
25
Net Profit
49
84
128
147
% chg
42
70
52
15
EBITDA (%)
9.7%
11.0%
12.0%
10.8%
EPS (Rs)
33
56
84
97
P/E (x)
34
20
13
11.4
P/BV (x)
4.4
3.8
3.0
2.5
RoE (%)
13.1
18.9
23.2
21.8
RoCE (%)
19.7
27.9
32.3
29.2
Kripashankar Maurya
EV/EBITDA
14.4
9.8
6.2
5.4
022-39357800 Ext: 6004
Source: Company, Angel Research
Valuation done based on 12th February, 2019 closing price
Please refer to important disclosures at the end of this report
1
Automotive Axles | 3QFY2019 Result Update
3QFY2019 Performance
In Cr
Q3FY19
Q3FY18
Q2FY19
YOY %
QOQ%
Net Sales
486
408
498
19%
-3%
Total Income
486
408
498
19%
-3%
Total Expenditure
430
364
440
18%
-2%
Raw Material Consumed
396
292
350
36%
13%
Stock Adjustment
-60
-7
-10
NA
NA
Purchase of Finished Goods
0
0
0
NA
NA
COGS
335
284
340
18%
-1%
Employee Expenses
32
28
31
11%
1%
% of sales
0
0
0
Other Expenses
63
51
68
24%
-7%
As a % of sales
13%
12%
14%
Raw Material Consumed
81%
71%
70%
Stock Adjustment
-12%
-2%
-2%
Purchase of Finished Goods
0%
0%
0%
COGS
69%
70%
68%
Gross Margin %
31%
30%
32%
Other Expenses
13%
12%
14%
EBITDA
56
44
59
26%
-5%
Other Income
0.72
1.2
0.9
-38%
-17%
Interest
0.15
0.1
0.2
28%
-23%
PBDT
56.19
45.19
59.45
NA
-5%
Depreciation
11.45
12
12
-2%
-7%
PBT
44.74
33.56
47.20
33%
-5%
Tax
14.35
12
15
16%
-6%
PAT
30
21
32
43%
-5%
Ratios
BPS
BPS
EBITDA margin (%)
11.45%
10.83%
11.79%
63
-34
PAT margin %
6.26%
5.20%
6.42%
106
-16
Tax rate %
32.08%
36.85%
32.21%
-478
-13
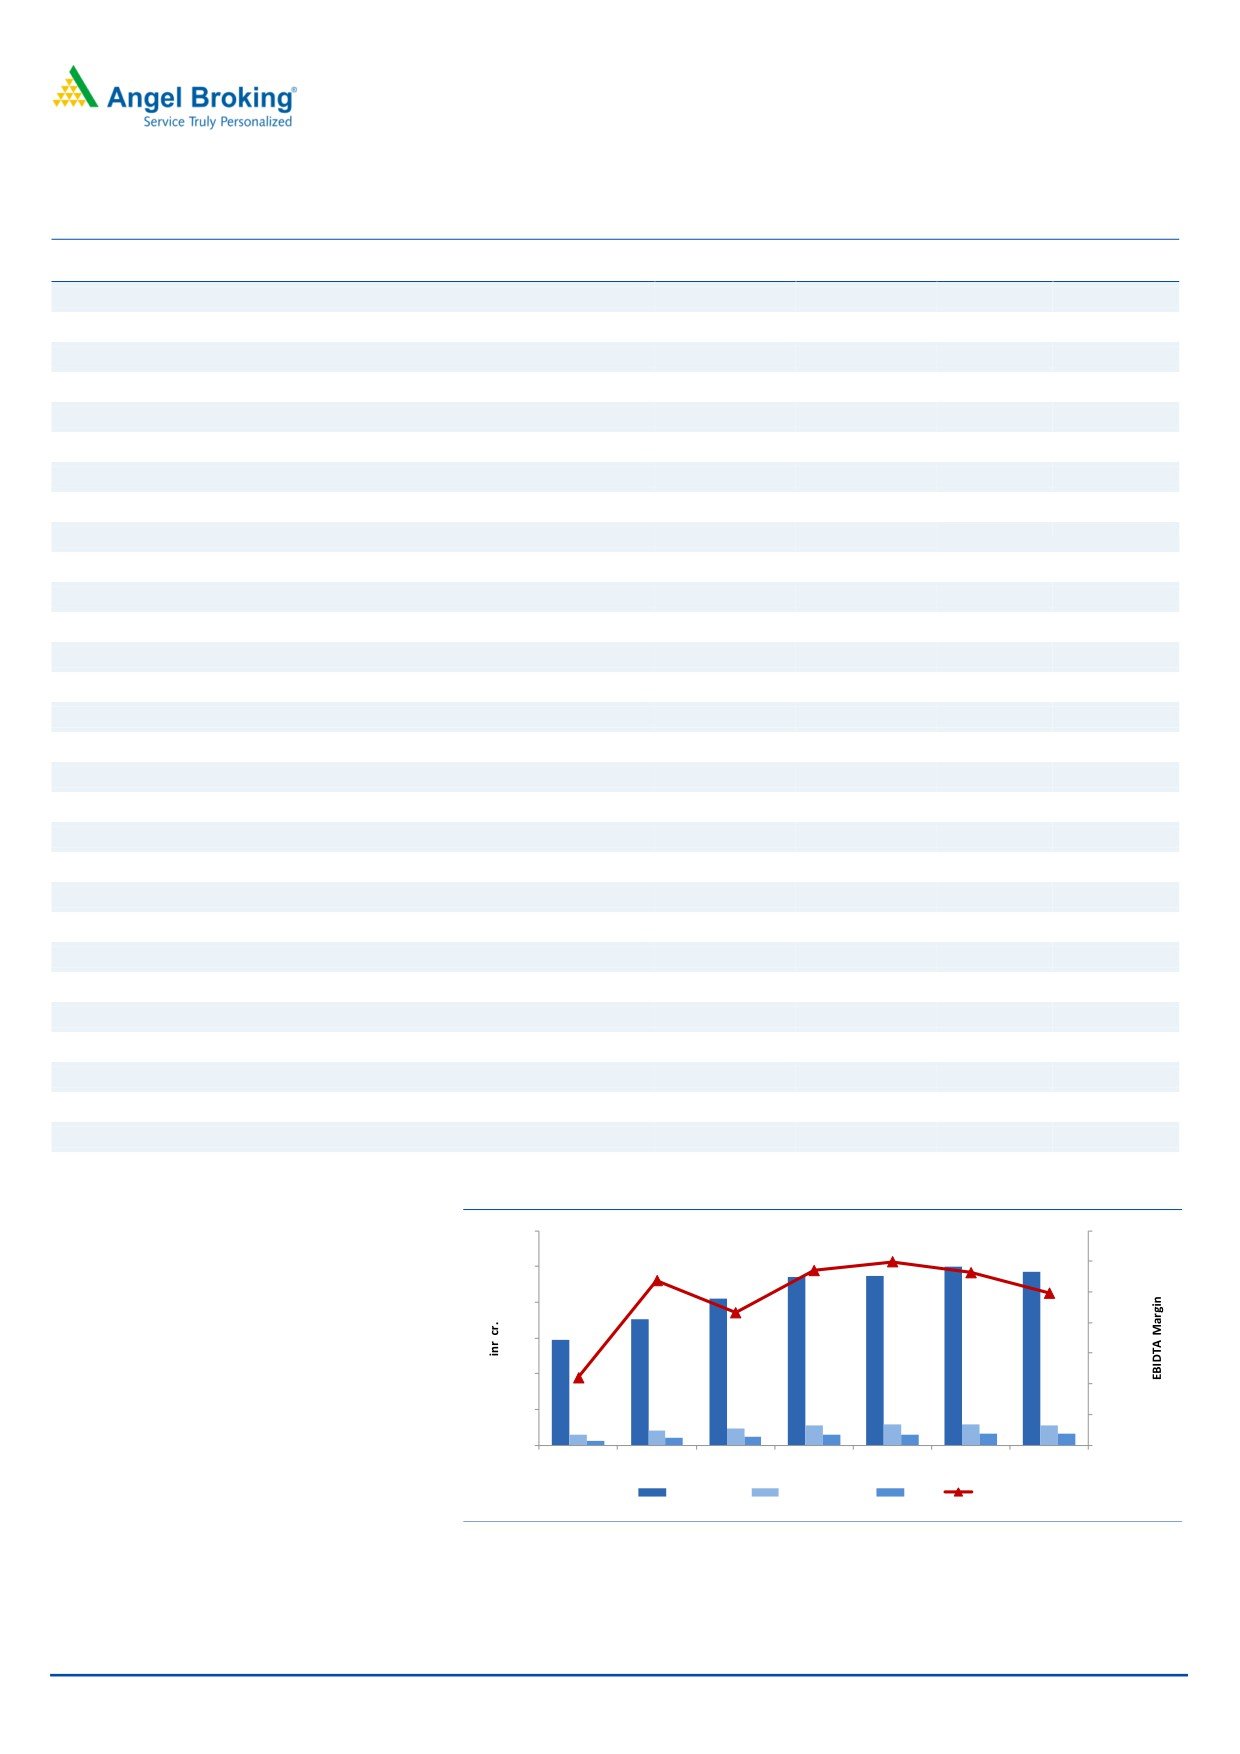
Quarterly performance charts
600
12.50%
498
486
470
475
12.00%
500
409
11.50%
400
351
294
11.00%
300
10.50%
200
10.00%
100
56
57
59
56
41
46
9.50%
30
20
22
28
29
32
31
13
0
9.00%
Q1FY18
Q2FY18
Q3FY18
Q4FY18
Q1FY19
Q2FY19
Q3FY19
Sales Rs. Cr.
EBIDTA Rs. Cr.
PAT
Margin
Source: Company, Angel Research
February 13, 2019
2
Automotive Axles | 3QFY2019 Result Update
Income statement
Y/E March (` cr)
FY17
FY18
FY19E FY20E
Total operating income
1,172
1,519
2,070
2,584
% chg
8
30
36
25
Total Expenditure
1,059
1,352
1,821
2,304
Raw Material
826
1,079
1,449
1,809
Personnel
81
99
124
155
Selling and Administration Expenses
21
23
31
41
Others Expenses
130
151
217
299
EBITDA
114
167
248
280
% chg
20
47
49
13
(% of Net Sales)
9.7%
11.0%
12.0%
10.8%
Depreciation& Amortisation
39
43
54
51
EBIT
74
124
194
229
% chg
33
67
57
18
(% of Net Sales)
6
8
9
9
Interest & other Charges
1
1
5
11
Other Income
2
5
5
5
Recurring PBT
75
128
194
223
% chg
46
70
52
15
Tax
26
44
67
77
PAT (reported)
49
84
128
147
% chg
42
70
52
15
(% of Net Sales)
4.2
5.5
6.2
5.7
Basic & Fully Diluted EPS (Rs)
33
56
84
97
% chg
42
70
52
15
Source: Company, Angel Research
February 13, 2019
3
Automotive Axles | 3QFY2019 Result Update
Balance sheet
Y/E March (`cr)
FY17
FY18
FY19E
FY20E
SOURCES OF FUNDS
Equity Share Capital
15.1
15.1
15.1
15.1
Reserves& Surplus
361
429
535
657
Shareholders Funds
377
444
550
673
Total Loans
-
-
51
111
Other Liabilities
3
2
0
0
Total Liabilities
379
446
602
783
APPLICATION OF FUNDS
Net Block
146
118
125
116
Capital Work-in-Progress
7
17
7
0
Investments
-
6
8
10
Long Term Loans & Advances
15
21
17
34
Current Assets
393
570
824
1,094
Inventories
99
137
170
198
Sundry Debtors
231
350
471
566
Cash
35
44
176
287
Loans & Advances
1
1
1
1
Investments & Others
27
37
6
41
Current liabilities
182
285
379
472
Net Current Assets
211
285
445
622
Other Non Current Asset
-
-
-
-
Total Assets
379
446
602
783
Source: Company, Angel Research
February 13, 2019
4
Automotive Axles | 3QFY2019 Result Update
Cash Flow
Y/E March (`cr)
FY17
FY18
FY19E
FY20E
Profit before tax
75
128
194
223
Depreciation
39
43
54
51
Change in Working Capital
(35)
81
(0)
(30)
Interest / Dividend (Net)
1
1
5
11
Direct taxes paid
26
44
67
77
Others
(9)
(245)
(139)
(88)
Cash Flow from Operations
97
51
181
244
(Inc.)/ Dec. in Fixed Assets
(23)
(30)
(49)
(39)
(Inc.)/ Dec. in Investments
1
3
(2)
(2)
Cash Flow from Investing
(23)
(27)
(51)
(41)
Issue of Equity
-
-
-
-
Inc./(Dec.) in loans
-29
-
51
60
Others
(11)
(15)
(49)
(151)
Cash Flow from Financing
(40)
(15)
2
(92)
Inc./(Dec.) in Cash
35
9
132
111
Opening Cash balances
0
35
44
176
Closing Cash balances
35
44
176
287
Source: Company, Angel Research
Key Ratio
Y/E March
FY17
FY18
FY19E
FY20E
P/E (on FDEPS)
34
20
13
11
P/CEPS
15
10
7
6
P/BV
4
4
3
2
EV/Sales
1
1
1
1
EV/EBITDA
14
10
6
5
EV / Total Assets
3
2
2
1
Per Share Data (Rs)
EPS (Basic)
33
56
84
97
EPS (fully diluted)
33
56
84
97
Cash EPS
75
113
163
180
DPS
8
14
14
14
Book Value
249
294
364
445
Returns (%)
ROCE
20
28
32
29
Angel ROIC (Pre-tax)
22
33
47
47
ROE
13
19
23
22
Turnover ratios (x)
Inventory / Sales (days)
31
33
30
28
Receivables (days)
72
84
83
80
Payables (days)
53
62
60
60
Working capital cycle (ex-cash) (days)
50
55
53
48
Source: Company, Angel Research
February 13, 2019
5
Automotive Axles | 3QFY2019 Result Update
Research Team Tel: 022 - 39357800
DISCLAIMER:
Angel Broking Limited (hereinafter referred to as “Angel”) is a registered Member of National Stock Exchange of India Limited, Bombay
Stock Exchange Limited, Metropolitan Stock Exchange Limited, Multi Commodity Exchange of India Ltd and National Commodity &
Derivatives Exchange Ltd It is also registered as a Depository Participant with CDSL and Portfolio Manager and Investment Adviser with
SEBI. It also has registration with AMFI as a Mutual Fund Distributor. Angel Broking Limited is a registered entity with SEBI for Research
Analyst in terms of SEBI (Research Analyst) Regulations, 2014 vide registration number INH000000164. Angel or its associates has not
been debarred/ suspended by SEBI or any other regulatory authority for accessing /dealing in securities Market. Angel or its
associates/analyst has not received any compensation / managed or co-managed public offering of securities of the company covered
by Analyst during the past twelve months.
This document is solely for the personal information of the recipient, and must not be singularly used as the basis of any investment
decision. Nothing in this document should be construed as investment or financial advice. Each recipient of this document should make
such investigations as they deem necessary to arrive at an independent evaluation of an investment in the securities of the companies
referred to in this document (including the merits and risks involved), and should consult their own advisors to determine the merits and
risks of such an investment.
Reports based on technical and derivative analysis center on studying charts of a stock's price movement, outstanding positions and
trading volume, as opposed to focusing on a company's fundamentals and, as such, may not match with a report on a company's
fundamentals. Investors are advised to refer the Fundamental and Technical Research Reports available on our website to evaluate the
contrary view, if any
The information in this document has been printed on the basis of publicly available information, internal data and other reliable
sources believed to be true, but we do not represent that it is accurate or complete and it should not be relied on as such, as this
document is for general guidance only. Angel Broking Limited or any of its affiliates/ group companies shall not be in any way
responsible for any loss or damage that may arise to any person from any inadvertent error in the information contained in this report.
Angel Broking Limited has not independently verified all the information contained within this document. Accordingly, we cannot testify,
nor make any representation or warranty, express or implied, to the accuracy, contents or data contained within this document. While
Angel Broking Limited endeavors to update on a reasonable basis the information discussed in this material, there may be regulatory,
compliance, or other reasons that prevent us from doing so.
This document is being supplied to you solely for your information, and its contents, information or data may not be reproduced,
redistributed or passed on, directly or indirectly.
Neither Angel Broking Limited, nor its directors, employees or affiliates shall be liable for any loss or damage that may arise from or in
connection with the use of this information.
Disclosure of Interest Statement
Automotive Axles
1. Financial interest of research analyst or Angel or his Associate or his relative
No
2. Ownership of 1% or more of the stock by research analyst or Angel or associates or
No
relatives
3. Served as an officer, director or employee of the company covered under Research
No
4. Broking relationship with company covered under Research
No
February 13, 2019
6